Microarchitectural Attacks on ARM: Part 2
24 Apr 2023
In this post, I would like to revise and update results for the shared-cache DoS attack that I presented here.
Table of Contents
Replace Wall-Clock Timers
Previously, I used functions
#include <sys/time.h>

int gettimeofday(struct timeval *restrict tv,
                 struct timezone *restrict tz);
and
#include <time.h>

int clock_gettime(clockid_t clockid, struct timespec *tp);
to obtain wall-clock timing measurements1. This time, based on the knowledge about the ARM PMU, I will replace these wall-clock timers with the ARMv7 cycle counter, which is able to count every cycle or every 64th cycle. Specifically, there are three steps to perform. The first step is to execute the following two inline assembly statements inside the kernel (the second may be optional):
/* Enable user-mode access to the counter */
asm volatile ("MCR p15, 0, %0, c9, c14, 0\t\n" :: "r"(1));

/* Disable counter overflow interrupts */
asm volatile ("MCR p15, 0, %0, c9, c14, 2\t\n" :: "r"(0x8000000f));
The second step is to initialize the counter:
static inline void init_pmcr(int32_t do_reset, int32_t enable_divider)
{
    // In general enable all counters (including cycle counter)
    int32_t value = 1;

    // Peform reset:
    if (do_reset) {
        value |= 2; // reset all counters to zero
        value |= 4; // reset cycle counter to zero
    }
    if (enable_divider)
        value |= 8; // enable "by 64" divider for CCNT
    value |= 16;

    // Set Performance Monitor Control Register (PMCR):
    asm volatile("MCR p15, 0, %0, c9, c12, 0\t\n" ::"r"(value));
    // Set CouNT ENable Set (CNTENS) Register:
    asm volatile("MCR p15, 0, %0, c9, c12, 1\t\n" ::"r"(0x8000000f));
    // Set Overflow Flag Status (FLAG) Register:
    asm volatile("MCR p15, 0, %0, c9, c12, 3\t\n" ::"r"(0x8000000f));
}
If enable_divider is one, the cycle counter increases for every \(64\) cycles. This is useful if we want to measure long times that would otherwise cause the counter to overflow. Finally, call the following function to read the Performance Monitors Cycle CouNT Register (PMCCNTR)’s value:
static inline unsigned int get_ccnt(void)
{
    unsigned int value;
    asm volatile("MRC p15, 0, %0, c9, c13, 0\t\n" : "=r"(value));
    return value;
}
or, equivalently:
// In: https://github.com/thoughtpolice/enable_arm_pmu/blob/master/armpmu_lib.h
static inline uint32_t
rdtsc32(void)
{
#if defined(__GNUC__) && defined(__ARM_ARCH_7A__)
    uint32_t r = 0;
    asm volatile("MRC p15, 0, %0, c9, c13, 0" : "=r"(r) );
    return r;
#else
#error Unsupported architecture/compiler!
#endif
}
The purpose of the PMCCNTR is to count the number of clock cycles since it was reset. However, there is no way to restrict the measurement to a specific process/thread. Test our cycle counter inside this simple program:
uint64_t cc1, cc2, overhead;
volatile uint8_t *addr;
unsigned int junk = 0;
int i;

// Measure counting overhead:
init_pmcr(1, 0);
overhead = get_ccnt();
overhead = get_ccnt() - overhead;

// Access selected array elements
for (i = 0; i < N; i += 2) {
    array[i * 4096] = 1;
}

for (i = 0; i < N; i++) {
    addr = &array[i * 4096];
    cc1 = get_ccnt();
    junk = *addr;
    cc2 = get_ccnt() - cc1;
    printf("Access time for array[%d * 4096]: %4u\n", i, (unsigned int)cc2);
}
printf("Overhead: %d\n", overhead);
The output looks like this:
Access time for array[0 * 4096]:   41
Access time for array[1 * 4096]: 4190
Access time for array[2 * 4096]:   41
Access time for array[3 * 4096]: 3854
Access time for array[4 * 4096]:   41
Access time for array[5 * 4096]: 3771
Access time for array[6 * 4096]:   41
Access time for array[7 * 4096]: 3743
Access time for array[8 * 4096]:  135
Access time for array[9 * 4096]: 3743
Overhead: 0
Update Latency Measurements
In convenience, I compiled bandwidth.c into two executables, bandwidth_read and bandwidth_write. Then, I collected measurements for two metrics, the average CPU cycles per working set and the number of bytes read per cycle, generated by the latency.c program.
When I ran the attack as below:
for (( i=1; i<=$n; i++ ))
do
    ./bandwidth_read 0 &
done
./latency 0
I obtained the following results:
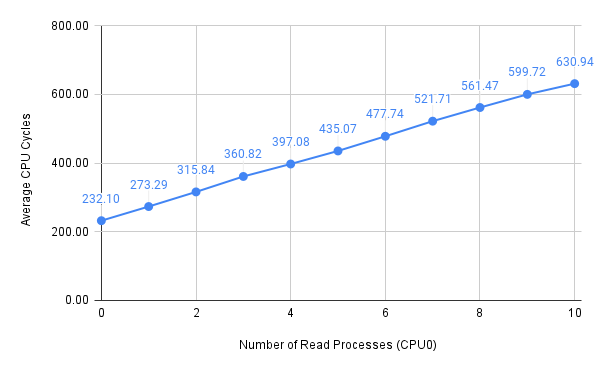
Figure 1: Average CPU cycles with all processes bound to CPU0
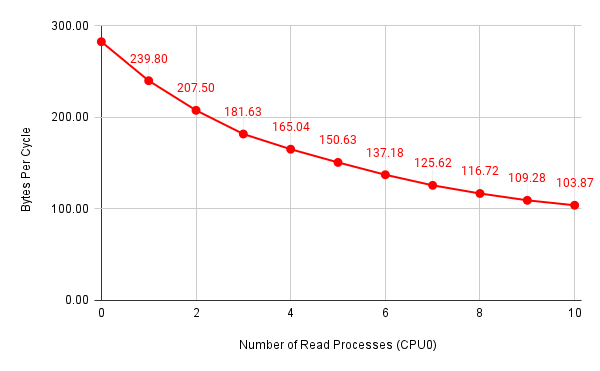
Figure 2: Number of bytes per cycle with all processes bound to CPU0
When I ran the attack as below:
for (( i=1; i<=$n; i++ ))
do
    ./bandwidth_write 2 &
done
./latency 2
I obtained the following results:
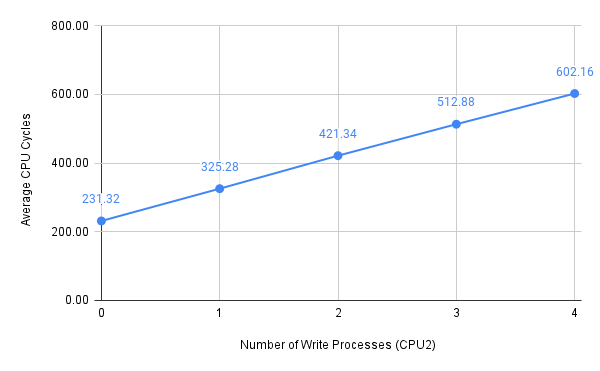
Figure 3: Average CPU cycles with all processes bound to CPU2
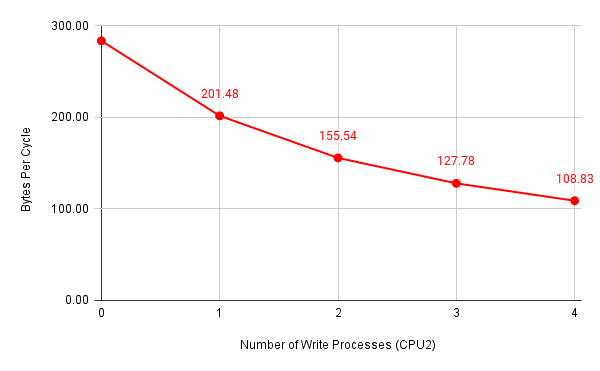
Figure 4: Number of bytes per cycle with all processes bound to CPU2
I also randomly set CPU affinity using run_attack.sh, with the first argument specifies which type of attack to launch and the second argument the number of parallel attacks:
#!/bin/bash

path=$(dirname "$0")
prog=bandwidth_$1
for (( i=1; i<=$2; i++ ))
do
    $path/$prog $(( RANDOM % 4 )) &
done
$path/latency $(( RANDOM % 4 ))
Then, I got two new sets of measurements:
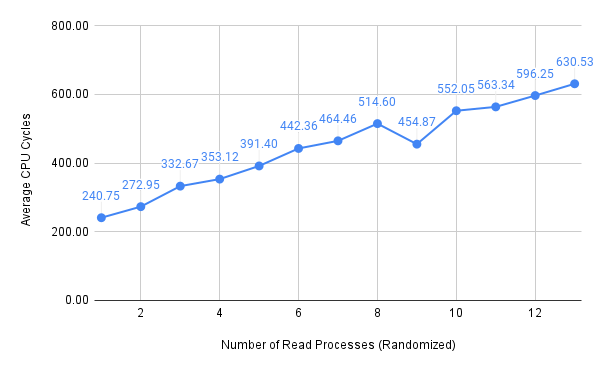
Figure 5: Average CPU cycles (memory reads, randomized CPU assignment)
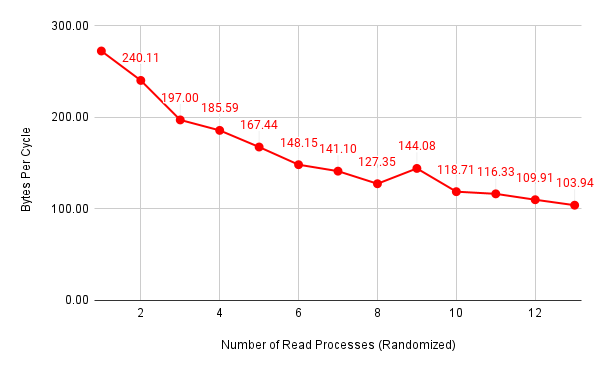
Figure 6: Number of bytes per cycle ((memory reads, randomized CPU assignment))
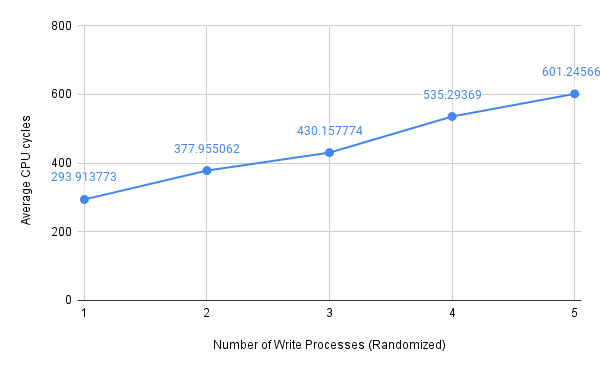
Figure 7: Average CPU cycles (memory writes, randomized CPU assignment)
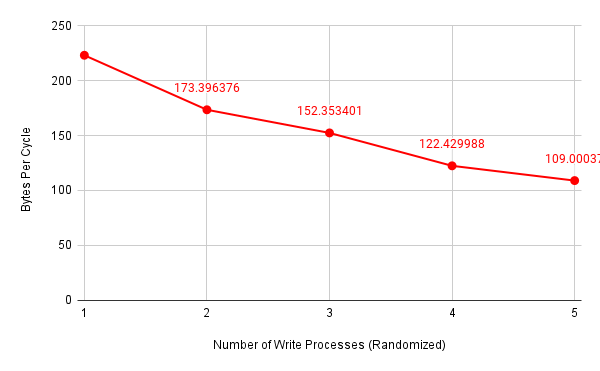
Figure 8: Number of bytes per cycle (memory writes, randomized CPU assignment)
Since I used unsigned int-typed variables to store CPU cycles in the latency.c program and I did not enable the “by 64” divider for the CCNT Register, there is an upper limit of average CPU cycles that I was able to reach, which is around \(630\). Nevertheless, we can see that it only required four or five parallel memory write attacks to reach this limit. It should also be noted that memory accesses faced a linear relationship between performance degradation and the number of parallel processes, despite how we managed CPU assignment.
Footnotes
-
The
gettimeofday()system call returns the number of seconds and microseconds since the Epoch, which is defined as midnight (0:00) January 1, 1970 UTC. The problem with using a time-of-day report such as thegettimeofday()system call is that the time-of-day clock may be spontaneously adjusted to keep the system’s time of day synchronized with UTC time, for example, via the Network Time Protocol (NTP). Whenever the time is adjusted, measuring interval between start and stop times becomes invalid, and, unless we notice something bizarre such as an end time that is less than the start time, we will not even know that an adjustment took place. Theclock_gettime()system call is a successor to thegettimeofday()system call with a few key changes: higher precision and the ability to request specific clocks. ⤴
Last updated: 2023-04-26